
 Cal. No. W410
 Refine your search
W410
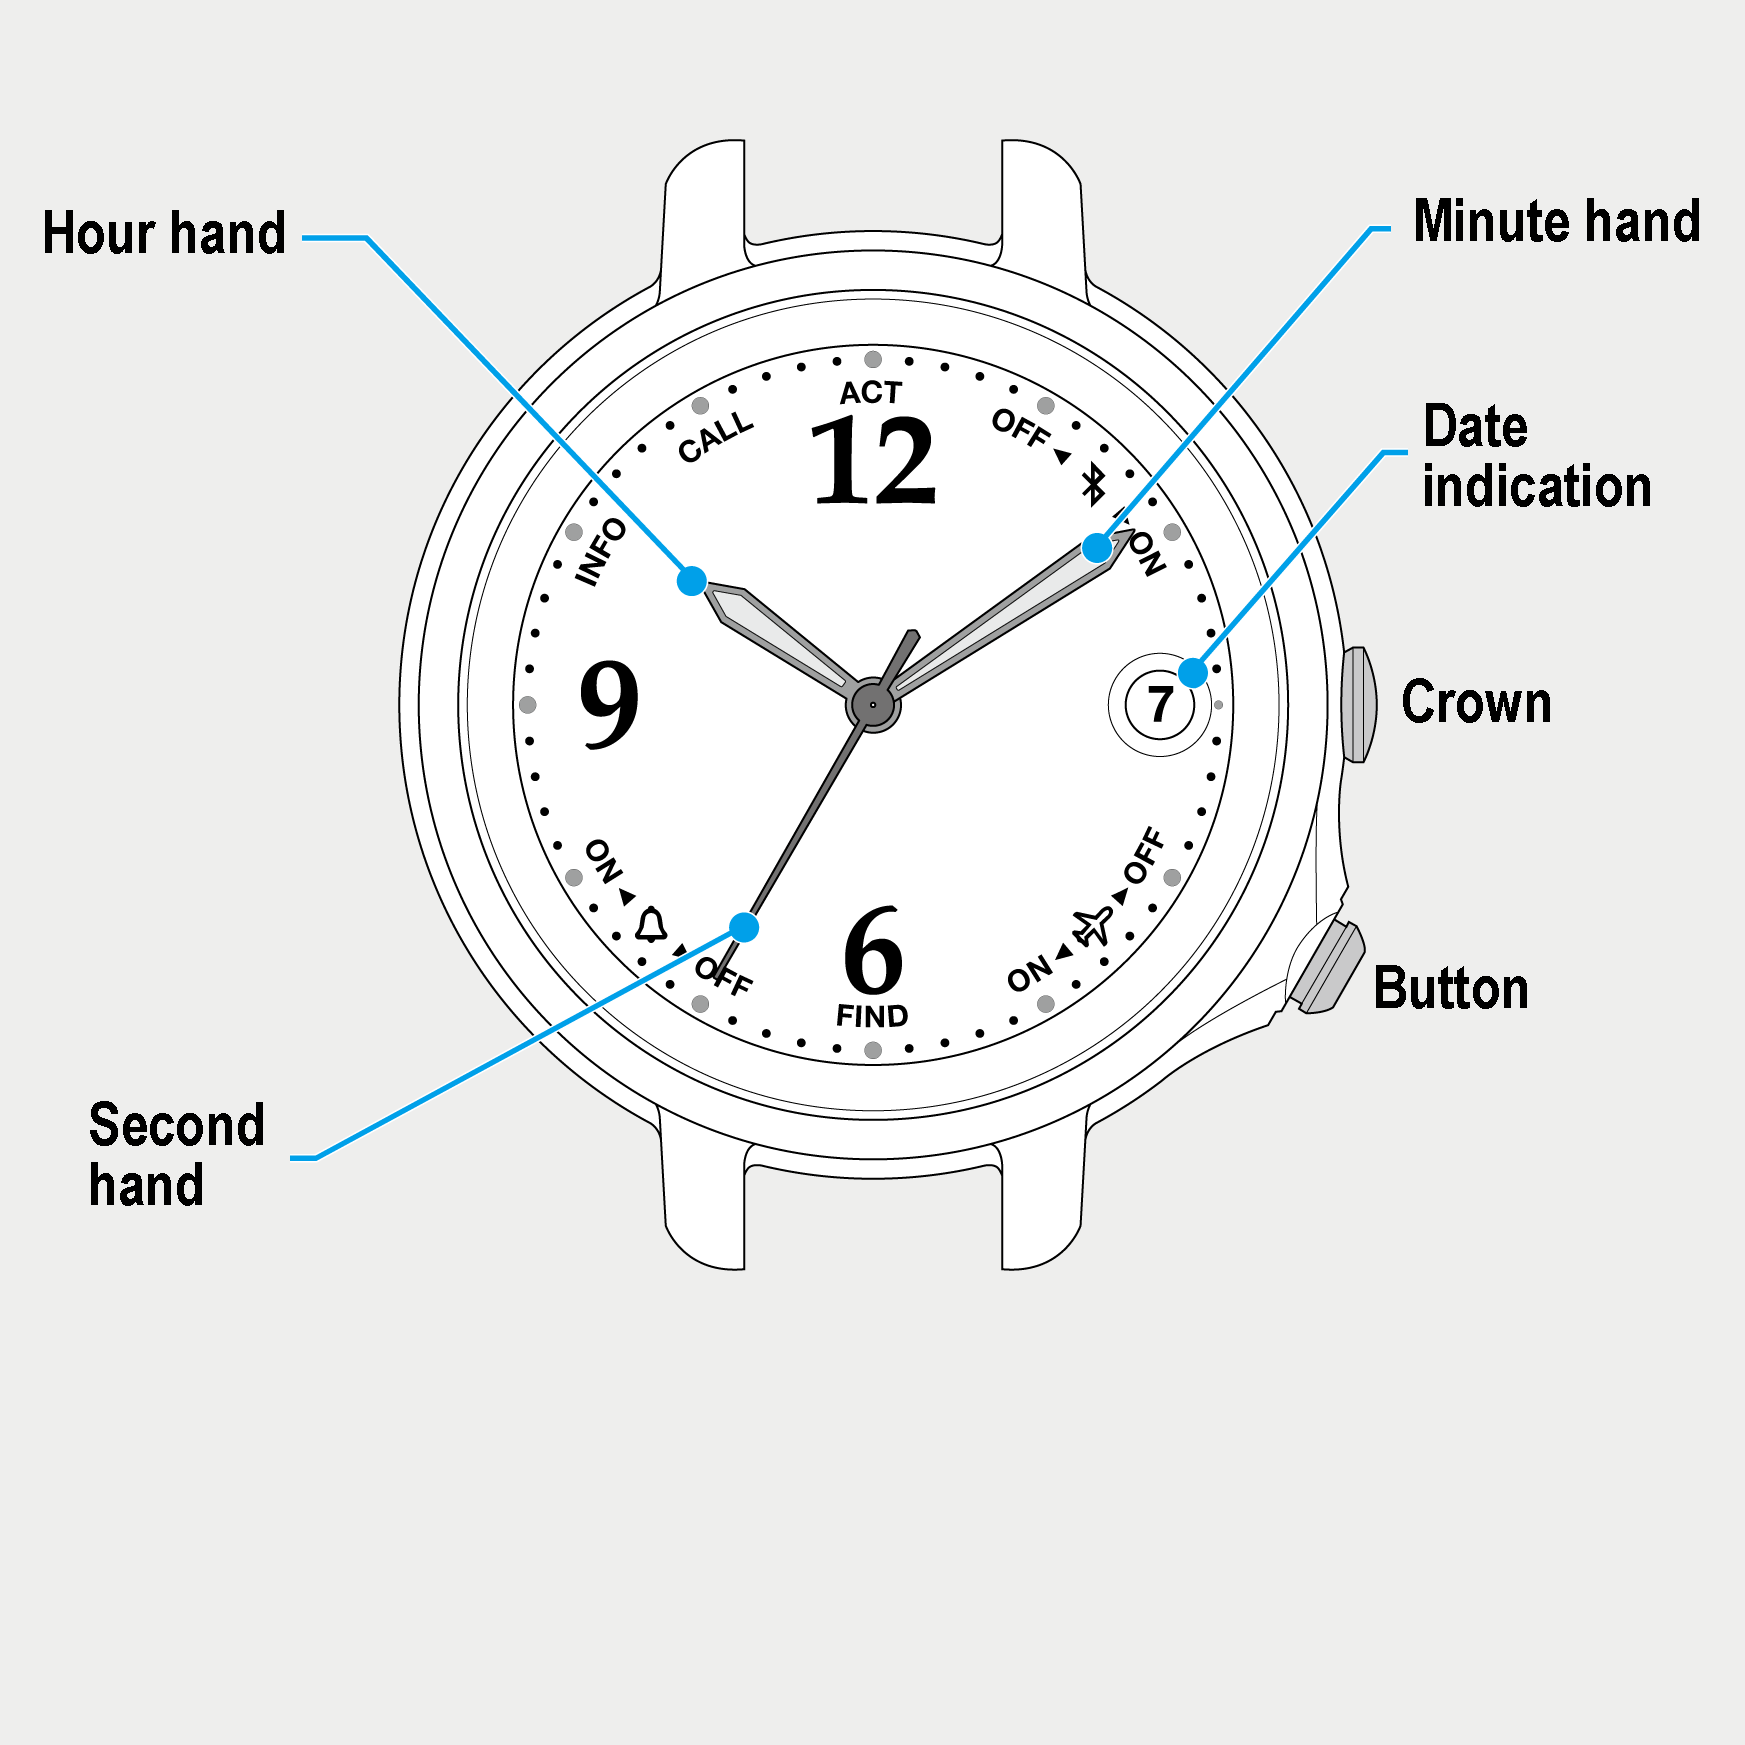
Using functions of the dedicated app
Checking the record of power generation amount of the watch
Tapping the [Light Level] icon on the home screen switches it to the [Light Level] screen.
You can see the record of power generation amount of the watch in a line graph on the [Light Level] screen.
You can see daily record ([Day]) and monthly one ([Month]).
- Data of power generation amount are stored in the dedicated app.
- Data storing period of the power generation amount varies depending on storage space your smartphone.
- Past power generation data is removed if you remove the dedicated app.
Indication of daily power generation amount ([Day])
Power generation amount of a day is indicated in a line graph with dots per hour.
Higher position of a dot means larger power generation amount.
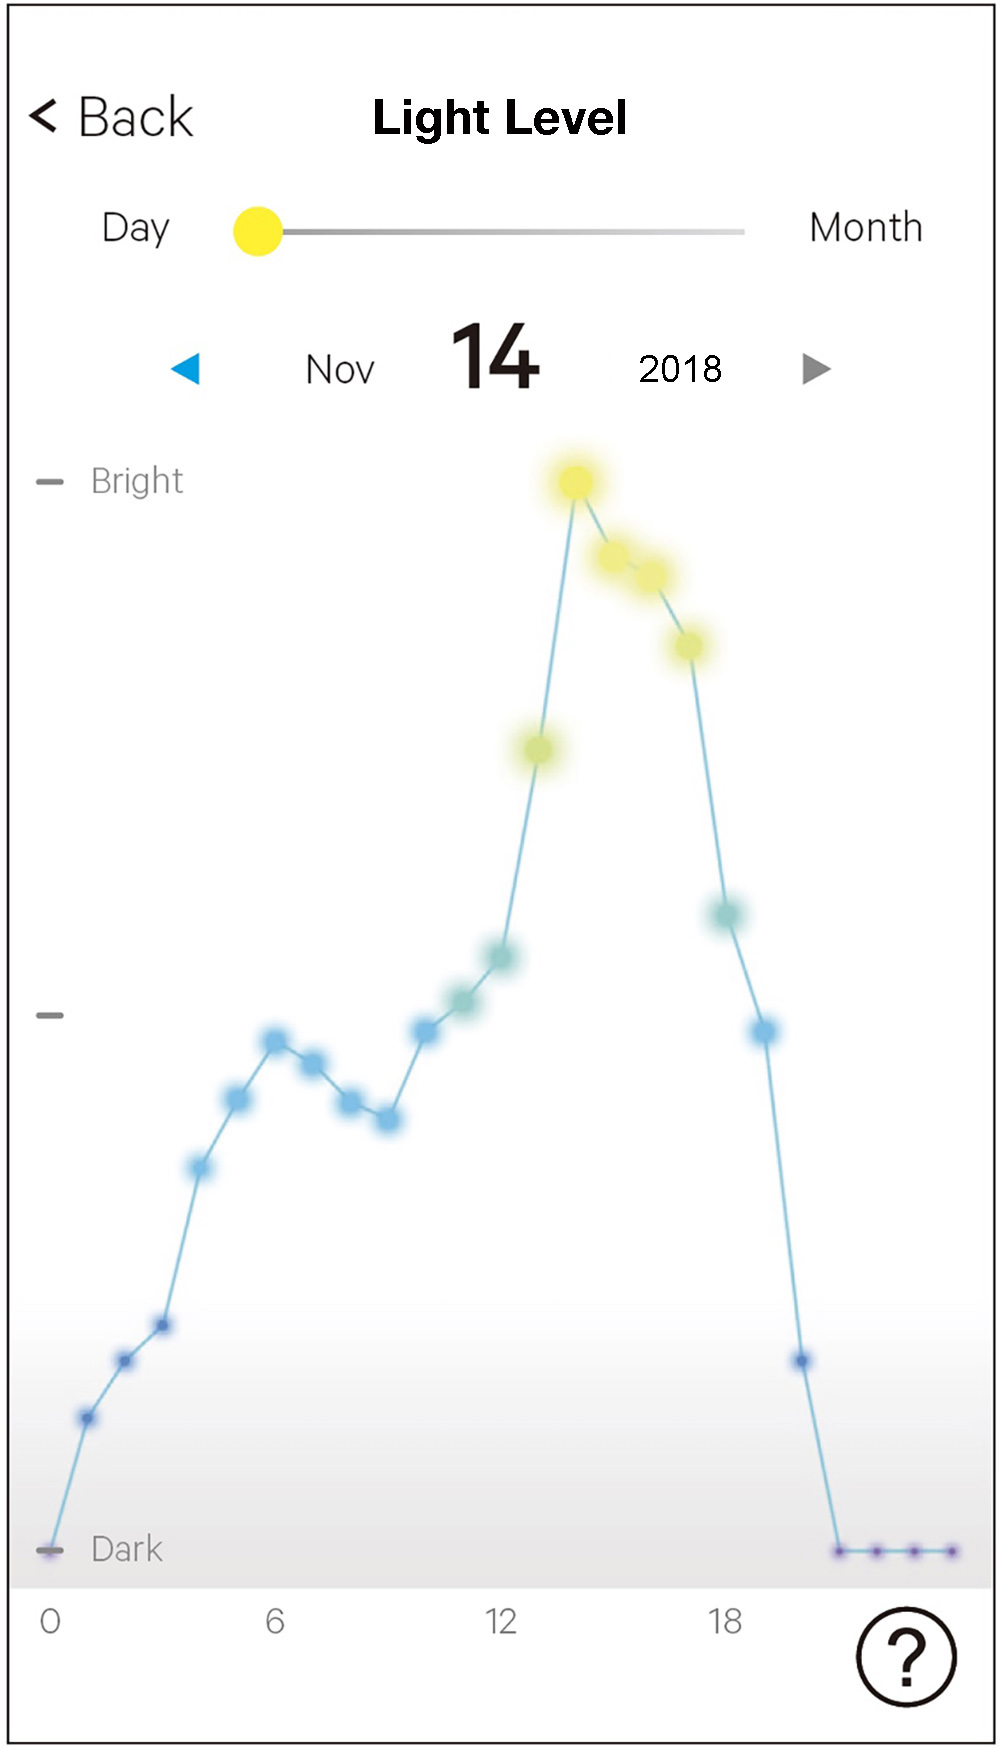
 | Tap here to switch the screen to [Month] (month). | |
 | Tap an arrow at the side of the date to change date. | |
 | Dots showing power generation amount of every hour | |
 | Tap to call the help screen. |
Graphs of monthly power generation amount ([Month])
Power generation amount of a month is indicated in a line graph with dots per day.
Position nearer to the right side of a dot means larger power generation amount.
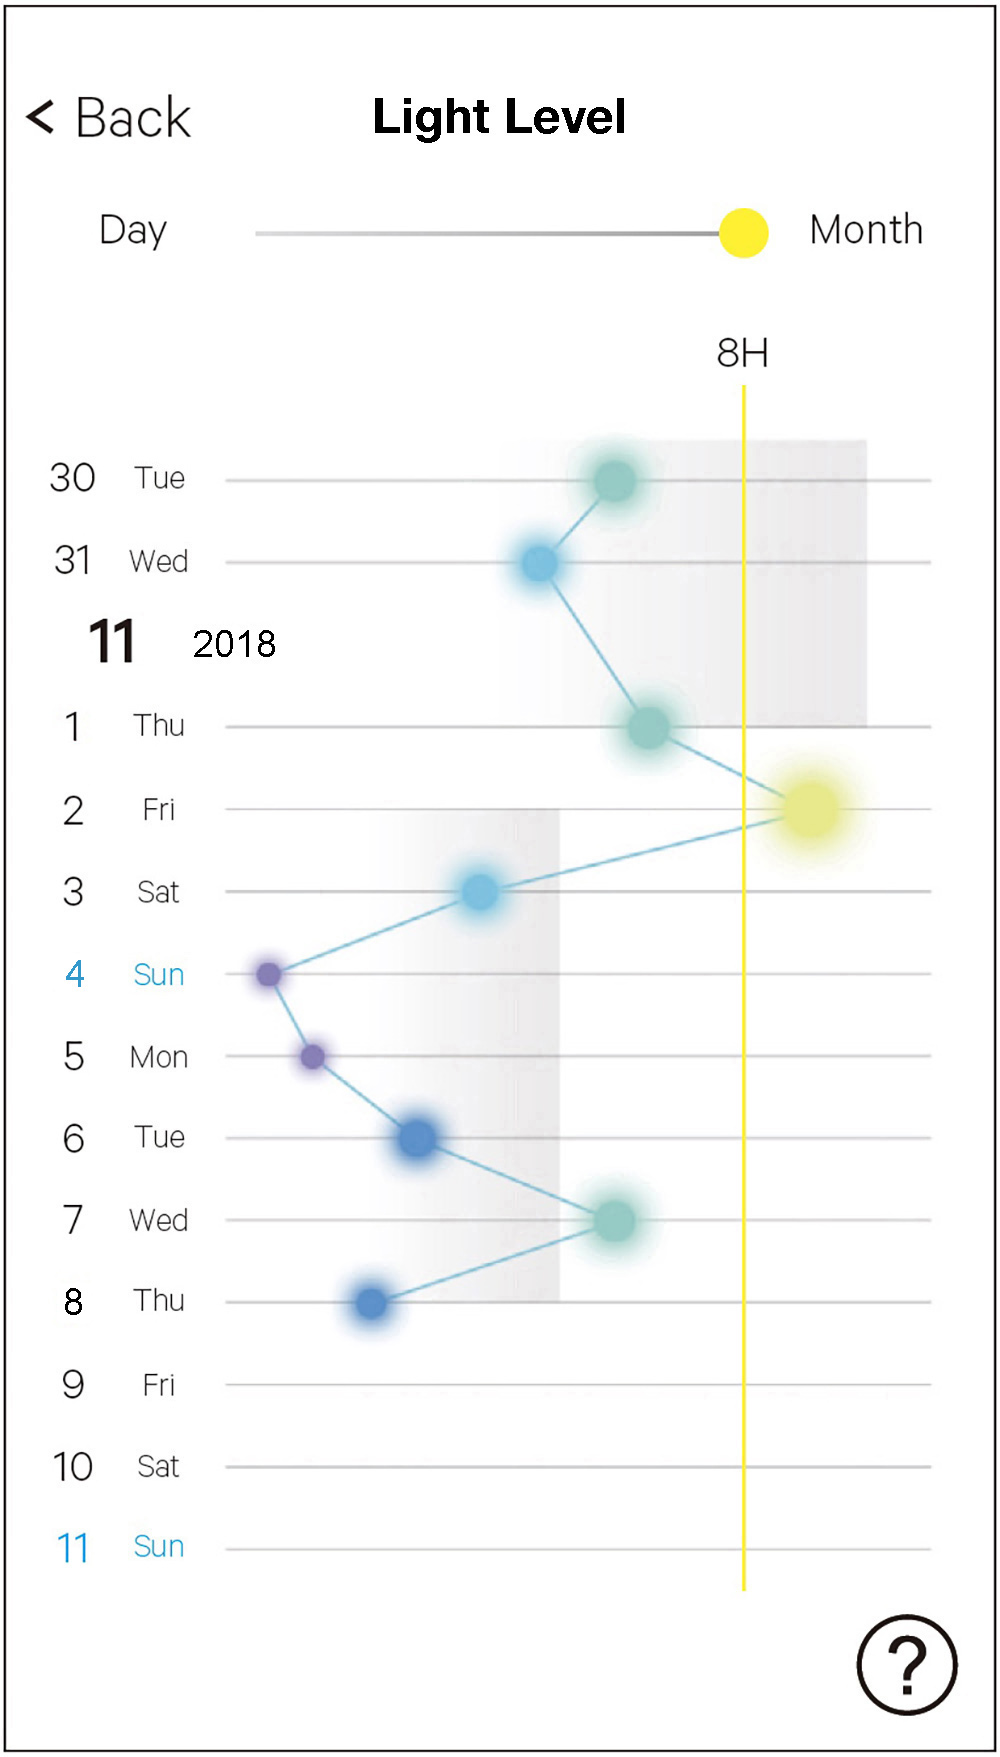
 | The consecutive connection time currently set is indicated here. Tap here to adjust consecutive connection time setting. |
|
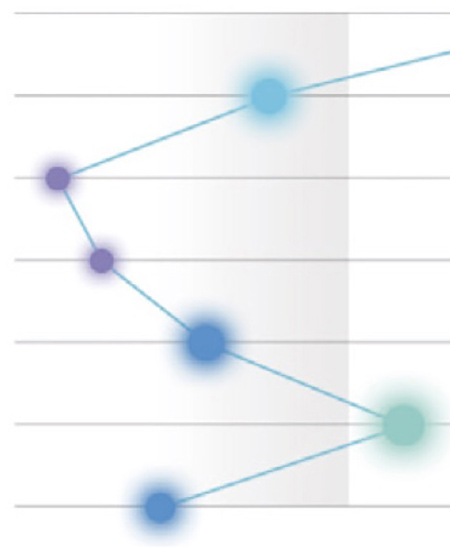 | The gray area indicates the total power generation amount of a week. When the area does not reach the yellow line, power generation amount is not sufficient for current consecutive connection time setting. |
|
| Tap to call the help screen. |